 |
||||||||||||||||||||||||||||||||||||||||||||||||||||||||||||||
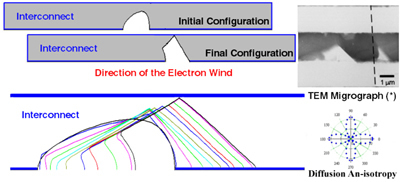
Intragranual void motion in un-passivated lines with Anisotropy & Void Growth Figure 1: Void morphology evolution for a Critical initial void configuration lying on a (110) plane along [110] direction under the Anisotropic surface diffusion and Void Growth conditions. Electron wind intensity
In Figure (1), the void shape chosen to be critical-asymmetric with respect to the direction of the electron flow. In this simulation experiment, we have taken into account the growth process, which is very important in the formation of the wedge shape final configuration before the complete failure of the embedding interconnect. Especially, the four-fold asymmetry (m=2, and {100} planes in Al) in the anisotropic diffusion coefficient becomes a main factor in the development of the straight advancing front (faceting), which somehow accelerates the early open circuit failure due to a wedge-shaped void hitting the upper edge of the interconnect. Figure 2: Void morphology evolution for a Critical initial void configuration lying on a (001) plane along [100] direction under the Anisotropic surface diffusion and Void Growth conditions. Electron wind intensity
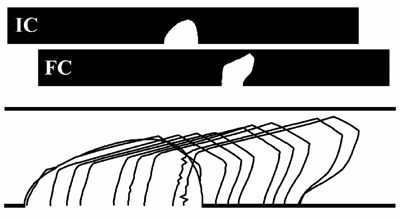
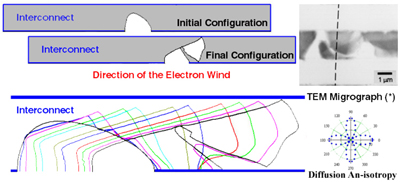
In Figure (2), the void shape chosen to be critical-asymmetric with respect to the direction of the electron flow and in this experiment the interface controlled growth process is taken into account. The six-fold asymmetry (m=3, and {111} planes in Al) in the anisotropic diffusion coefficient becomes a factor in the development of the straight advancing front (faceting), which somehow comparing to the isotropic case still accelerates the early open circuit failure due to a wedge-shaped void hitting the upper edge of the interconnect. Figure 3: Void morphology evolution for an Un-critical initial void configuration lying on a (001) plane along [100] direction under the Anisotropic surface diffusion and Void Growth conditions. Electron wind intensity
This figure shows clearly that as an intermediate step; the shape is converted into the critical form as suggested by the experimental studies performed by Arzt et al., Nix et al., and Kraft et al. At the final stage, the occurrence of an unusual fragmentation into a wedge-shaped daughter cell takes place, which results premature failure of the interconnect at an elapsed time of t=1.93x10⁻³. This situation is also observed by experimentally as can be seen from the attached TEM micrograph. A simple comparison of Figures (2) and (3) namely the critical and un-critical initial void configurations, indicates very clearly that the critical void configuration yields about a factor of four shorter life time for the interconnect then the uncritical initial void shape defects. This tendency is also suggested by the experimental studies performed by Arzt et al.,25 which are given in the last column of Table I. Therefore, on the long run, both shapes are detrimental for aluminum interconnects having (001) x[100] texture. Table I: Influence of the initial configuration on the normalized effective time to failure (t x X).
From our simulation experiments, some of which are presented by figures (1) and (2), the effect of the degree of surface diffusion anisotropy in connection with the normalized effective time to failure t x X is observed and the relevant data is tabulated in Table I. It can be seen immediately that the normalized effective time to failure increases drastically as the degree of surface diffusion anisotropy increases. According to last column of this table the normalized effective time to failure (t x X) shows about one order of magnitude enhancement going from two fold symmetry to six fold symmetry. This result is in excellent agreement with the experimental findings of Joo and Thompson, which are given as t50 in the last column of Table II, concerning Al (110) and Al (111) on SiO2 substrates. Table II: Influence of the degree of surface diffusion anisotropy on the normalized effective time to failure.
|
||||||||||||||||||||||||||||||||||||||||||||||||||||||||||||||